Debugging Production Issues with AI Agents: Automating Datadog Error Analysis
Written by
Graham Neubig
Published on
Running a production service is hard. Errors and bugs crop up due to product updates, infrastructure changes, or unexpected user behavior. When these issues arise, it's critical to identify and fix them quickly to minimize downtime and maintain user trust, but this is challenging especially at scale.
What if AI agents could handle the initial investigation automatically? This allows engineers to start out with a detailed report of the issue, including root cause analysis and specific recommendations for fixes, dramatically speeding up the debugging process.
In this post, we'll demonstrate how you can greatly speed up the debugging process by automating error analysis using AI agents built with the OpenHands Software Agent SDK. The code for this example is available as a ready-to-use GitHub Actions workflow that integrates with DataDog, but we'll show an example of it in action before diving into the code.
Error Tracking with Datadog
Datadog is a popular monitoring and analytics platform that provides comprehensive error tracking capabilities. It aggregates logs, metrics, and traces from your applications, making it easier to identify and investigate issues in production.
One feature that we particularly like is Datadog's Error Tracking, which groups similar errors together and provides detailed insights into their occurrences, stack traces, and affected services. You can see a screenshot example of a single datadog error below:
This is an example of an error where we can see on the surface that it's an issue decoding JSON somewhere, but we're not exactly sure where. Typically an SRE who is investigating this error would need to dig into the logs, search through the codebase, and try to figure out where this error is originating from.
Kicking Off Automated Debugging
Next, we can switch over to our GitHub repository where we have set up a GitHub Actions workflow that automates the debugging process using an OpenHands agent. Our GitHub Actions workflow can be triggered in two ways:
-
Search Query: You can provide a search query (e.g., "JSONDecodeError") to find all recent errors matching that pattern. This is useful for investigating categories of errors.
-
Specific Error ID: You can provide a specific Datadog error tracking ID to deep-dive into a known issue.
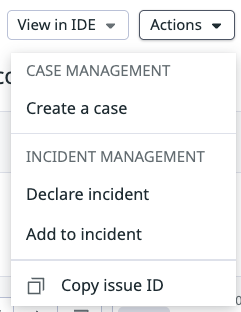
In this example, we can try the second one by clicking on the "Actions" button in DataDog's error tracking UI and copy the error ID to use as input to the workflow:
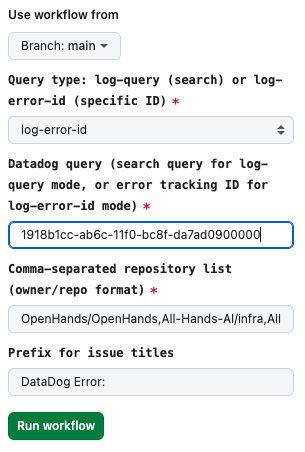
And then we travel to the GitHub Actions tab in our repository and manually trigger the workflow by providing the error ID as input:
Checking The Results
When the workflow runs, it automatically performs the following steps:
-
Get detailed info from the DataDog API
-
Create or find an existing GitHub issue to track the error
-
Clone all relevant repositories to get full code context
-
Run an OpenHands agent to analyze the error and investigate the code
-
Post the findings as a comment on the GitHub issue
As the workflow progresses, we can see comments on the issue being added by the agent with its findings. In this particular case of the JSONDecodeError, the agent was able to identify the exact file and line number where the error originated, determine the root cause, and provide specific recommendations for fixing it.
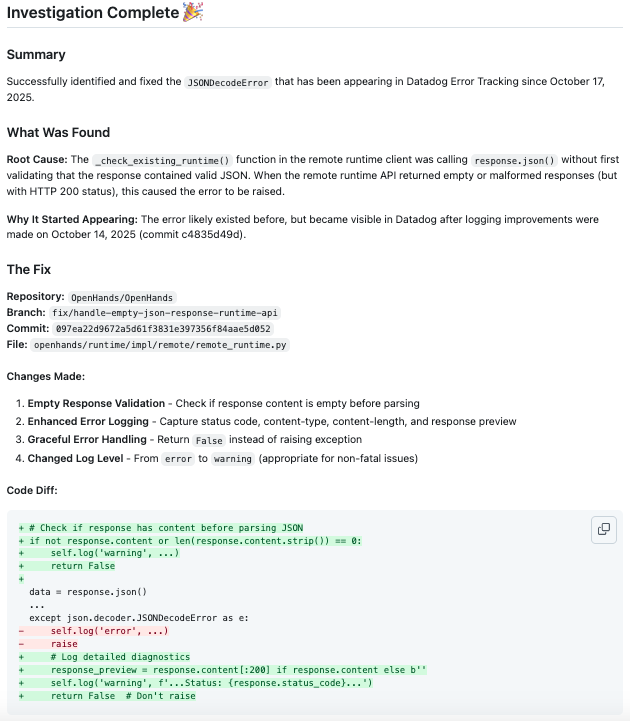
Noteably, we don't actually ask the agent to send a pull request to the codebase with the fix; we'd like a human engineer to review the findings first.
But if we did want it to create a fix, we can follow up on GitHub using the OpenHands GitHub integration and say @openhands go ahead and create a pull request to fix this issue based on your analysis, and it will do so automatically.
The Nitty-gritty Details
The complete Datadog debugging workflow is available in the OpenHands SDK repository as a ready-to-use example. You can find the full implementation on GitHub, including the workflow YAML file, Python script, and prompt template.
To set it up in your own repository:
-
Copy the workflow file to
.github/workflows/in your repository -
Configure the required secrets (Datadog API keys, LLM API key)
-
Customize the default queries and repository lists for your needs
-
Run the workflow manually or set up scheduled runs
The workflow is designed to work out of the box but is fully customizable. You can modify the prompts to focus on specific types of analysis, adjust the agent's tools to fit your workflow, or extend it to integrate with other services beyond GitHub and Datadog. And if you'd like more details about the SDK and additional examples, visit the OpenHands SDK repository and check out our docs to learn more.
We're excited to see what you build, and we welcome you to share your experiences in our community on Slack.
Get useful insights in our blog
Insights and updates from the OpenHands team
Sign up for our newsletter for updates, events, and community insights.
OpenHands is the foundation for secure, transparent, model-agnostic coding agents - empowering every software team to build faster with full control.


